Landsat
From World Wind Wiki
| Revision as of 14:55, 28 November 2005 (edit) Mkpl (Talk | contribs) m (reverted edit of 81.91.128.197) ← Previous diff |
Revision as of 07:47, 11 July 2010 (edit) (undo) Mkpl (Talk | contribs) m (Reverted edits by Mr Bigbunny (Talk); changed back to last version by Mkpl) Next diff → |
||
| (47 intermediate revisions not shown.) | |||
| Line 1: | Line 1: | ||
| - | Sponsored by [http://www.vidahost.com Vidahost webhosting] and [http://www.thermaldegree.com Thermal Degree web design]. | + | Sponsored by [http://www.vidahost.com Vidahost webhosting] and [http://www.thermaldegree.com Thermal Degree web design]. |
| <GoogleAds>fef</GoogleAds> | <GoogleAds>fef</GoogleAds> | ||
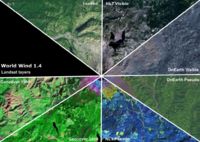
| + | [[Image:Landsats.jpg|thumb|200px|Mt. St. Helens - different Landsat layers]] | ||
| + | '''Landsat 7''' is a satellite of the [http://landsat.usgs.gov/project_facts/history/landsat_7.php USGS Landsat 7 Project]. The satellite is equipped with an Enhanced Thematic Mapper Plus (ETM+) instrument that is an eight-band multispectral scanning radiometer capable of providing moderate resolution image data of the Earth's surface. | ||
| - | LandSat 7 is a satellite of the [http://landsat.usgs.gov/ USGS Landsat Project]. The satellite is equiped with an ETM+ instrument that is an eight-band multispectral scanning radiometer capable of providing moderate resolution image data of the Earth's surface. | + | Various spectral band data are combined to produce an image. By using different bands you can get images that represent human eye perception or pseudo colorations that represent other spectrum normally not visible to the human eye, i.e., thermal, infrared, etc.. |
| - | The band information is combined to produce an image, and by using different bands you can get images that represent human eye perception, thermal, infrared or other visuals. | + | Landsat 7 data is available globally at a scale where you can pick out many prominent features. The maximum resolution is 15 meters per pixel on the panchromatic band (0.52 - 0.90µm) of the [http://en.wikipedia.org/wiki/Image:Electromagnetic-Spectrum.png electromagnetic spectrum]. |
| - | LandSat 7 data is available globally at a scale where you can pick out many prominent features in the landmass. The maximum resolution of the ETM+ is 15 meters per pixel on the panchromatic band. | + | == [http://www.i3.com i-cubed]== |
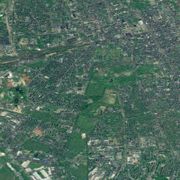
| + | [[Image:2022 2858.jpg|thumb|i-cubed highest resolution]] | ||
| + | An Isilon cluster was used by i3 to optimally process the raw Landsat7 data using sophisticated i3 color-balancing algorithms. Isilon systems donated to NASA were again used to rapidly build the i3 donated color-balanced imagery into World Wind's tiling scheme. Much thanks goes to [http://www.i3.com i3.com] and [http://www.isilon.com Isilon.com] for their generosity of donating this imagery for use within NASA World Wind. Some restrictions apply for this data, please see [[Copyright Questions When Using Images From World Wind|Copyright Questions When Using Images From World Wind]]. | ||
| + | |||
| + | ===i3 Visible=== | ||
| + | *The maximum resolution is 15 m per pixel. | ||
| + | *Uses bands 3, 2, 1 | ||
| + | <div style="clear: both"></div> | ||
| ==NLT== | ==NLT== | ||
| [[Image:1011_1429.jpg|thumb|NLT Visible highest resolution]] | [[Image:1011_1429.jpg|thumb|NLT Visible highest resolution]] | ||
| - | NASA Learning Technologies has processed the LandSat 7 data to create their own imagery. Pan-sharpening the images was planned, however other priorities mean that 30 meters will be the maximum resolution for the forseeable future. See [[NLT Landsat Processing Techniques]] for information on how the data was processed, and [[NLT Data Issues]] for known issues. | + | NASA Learning Technologies has processed the Landsat 7 data to create their own imagery. Pan-sharpening the images was planned, however other priorities mean that 30 meters will be the maximum resolution for the forseeable future. See [[NLT Landsat Processing Techniques]] for information on how the data was processed, and [[NLT Data Issues]] for known issues. |
| ===Visible=== | ===Visible=== | ||
| Line 21: | Line 30: | ||
| ==Geocover== | ==Geocover== | ||
| [[Image:GeoCover_2000_highest_resolution_sample.jpg|thumb|GeoCover 2000 highest resolution]] | [[Image:GeoCover_2000_highest_resolution_sample.jpg|thumb|GeoCover 2000 highest resolution]] | ||
| - | Geocover is a product of [http://www.mdafederal.com/ MDA Federal] (formerly EarthSat), and is pseudo color Landsat imagery. The 1990 data was acquired with LandSat 5, and the 2000 data with LandSat 7's ETM+. | + | Geocover is a product of [http://www.mdafederal.com/ MDA Federal] (formerly EarthSat), and is pseudo color Landsat imagery. The 1990 data was acquired with |
| + | [http://landsat.usgs.gov/project_facts/history/landsat_4.php Landsat 4] and [http://landsat.usgs.gov/project_facts/history/landsat_5.php Landsat 5], and the 2000 data with [http://landsat.usgs.gov/project_facts/history/landsat_7.php Landsat 7's] ETM+. | ||
| ===2000=== | ===2000=== | ||
| Line 33: | Line 43: | ||
| ==OnEarth== | ==OnEarth== | ||
| [[Image:4551_6432.jpg|thumb|OnEarth Visible highest resolution]] | [[Image:4551_6432.jpg|thumb|OnEarth Visible highest resolution]] | ||
| - | [http://onearth.jpl.nasa.gov/ OnEarth] is a project of the NASA Jet Propulsion Laboratory. OnEarth has asked that World Wind not access the imagery off its servers. This data is available in World Wind as ''Community Landsat 7''. | + | [http://onearth.jpl.nasa.gov/ OnEarth: WMS Global Mosaic] is a project of the NASA Jet Propulsion Laboratory. It is a 15-meter resolution global image mosaic of the Earth, produced from more than 8,200 individual [http://landsat.usgs.gov/project_facts/history/landsat_7.php Landsat 7] scenes. These images have been collected during 1999-2003. |
| ===Visible=== | ===Visible=== | ||
| Line 44: | Line 54: | ||
| ==Data Acquisition== | ==Data Acquisition== | ||
| - | Landsat 7 only gets one chance every 16 days to cover any given area. If there are clouds, fog, smog, snow on the ground (too white), too much grass on the ground (too green), too low or too high sun angle (low contrast), satellite maintenance, solar storm, etc, that chance is lost. A few bad takes in a row, and a whole year is lost. A scene is 160x180km, and a perfect scene has to have perfect conditions for the whole area. | + | [http://landsat.usgs.gov/project_facts/history/landsat_7.php Landsat 7] only gets one chance every 16 days to cover any given area. If there are clouds, fog, smog, snow on the ground (too white), too much grass on the ground (too green), too low or too high sun angle (low contrast), satellite maintenance, solar storm, etc, that chance is lost. A few bad takes in a row, and a whole year is lost. A scene is 160x180km, and a perfect scene has to have perfect conditions for the whole area. |
| Landsat 7 was launched in 1999 and now it has some data quality problems. The U.S. government is currently working toward a Landsat Data Continuity Mission ([http://ldcm.nasa.gov/ LDCM]), which will field a Landsat-like sensor on board the next-generation NOAA/DoD weather monitoring platform, or on-board a dedicated satellite. | Landsat 7 was launched in 1999 and now it has some data quality problems. The U.S. government is currently working toward a Landsat Data Continuity Mission ([http://ldcm.nasa.gov/ LDCM]), which will field a Landsat-like sensor on board the next-generation NOAA/DoD weather monitoring platform, or on-board a dedicated satellite. | ||
| - | The LandSat 7 data will be the best available global images for quite a while, and the fact that they are free and available on the net makes them even more significant. | + | The Landsat 7 data will be the best available global images for quite a while, and the fact that they are free and available on the net makes them even more significant. |
| ==External Links== | ==External Links== | ||
| *[https://zulu.ssc.nasa.gov/mrsid/tutorial/Landsat%20Tutorial-V1.html An Introductory Landsat Tutorial] | *[https://zulu.ssc.nasa.gov/mrsid/tutorial/Landsat%20Tutorial-V1.html An Introductory Landsat Tutorial] | ||
| *[http://www.emporia.edu/earthsci/student/acosta3/squaw_creek.htm emporia.edu] - has information about the bands | *[http://www.emporia.edu/earthsci/student/acosta3/squaw_creek.htm emporia.edu] - has information about the bands | ||
| + | *[https://zulu.ssc.nasa.gov/mrsid/docs/GeoCover_circa_1990_Product_Description.pdf GeoCover 1990] and [https://zulu.ssc.nasa.gov/mrsid/docs/GeoCover_circa_2000_Product_Description.pdf Geocover 2000] product descriptions (.pdf files) | ||
| + | *[http://onearth.jpl.nasa.gov/ OnEarth] | ||
| + | *[http://www.i3.com i-cubed] | ||
| + | *[http://www.mdafederal.com/ MDA Federal] | ||
| + | |||
| [[Category:End User Documentation]] | [[Category:End User Documentation]] | ||
| [[Category:Data Formats]] | [[Category:Data Formats]] | ||
Revision as of 07:47, 11 July 2010
Sponsored by Vidahost webhosting and Thermal Degree web design.
Landsat 7 is a satellite of the USGS Landsat 7 Project. The satellite is equipped with an Enhanced Thematic Mapper Plus (ETM+) instrument that is an eight-band multispectral scanning radiometer capable of providing moderate resolution image data of the Earth's surface.
Various spectral band data are combined to produce an image. By using different bands you can get images that represent human eye perception or pseudo colorations that represent other spectrum normally not visible to the human eye, i.e., thermal, infrared, etc..
Landsat 7 data is available globally at a scale where you can pick out many prominent features. The maximum resolution is 15 meters per pixel on the panchromatic band (0.52 - 0.90µm) of the electromagnetic spectrum.
Contents |
i-cubed
An Isilon cluster was used by i3 to optimally process the raw Landsat7 data using sophisticated i3 color-balancing algorithms. Isilon systems donated to NASA were again used to rapidly build the i3 donated color-balanced imagery into World Wind's tiling scheme. Much thanks goes to i3.com and Isilon.com for their generosity of donating this imagery for use within NASA World Wind. Some restrictions apply for this data, please see Copyright Questions When Using Images From World Wind.
i3 Visible
- The maximum resolution is 15 m per pixel.
- Uses bands 3, 2, 1
NLT
NASA Learning Technologies has processed the Landsat 7 data to create their own imagery. Pan-sharpening the images was planned, however other priorities mean that 30 meters will be the maximum resolution for the forseeable future. See NLT Landsat Processing Techniques for information on how the data was processed, and NLT Data Issues for known issues.
Visible
- The maximum resolution is 30 m per pixel.
- Uses bands 3, 2, 1
Pseudo
- The maximum resolution is 30 m per pixel.
Geocover
Geocover is a product of MDA Federal (formerly EarthSat), and is pseudo color Landsat imagery. The 1990 data was acquired with Landsat 4 and Landsat 5, and the 2000 data with Landsat 7's ETM+.
2000
- The maximum resolution is 15 m per pixel.
- Uses bands 7, 4, 2
1990
- The maximum resolution is 30 m per pixel.
- Uses bands 7, 4, 2
OnEarth
OnEarth: WMS Global Mosaic is a project of the NASA Jet Propulsion Laboratory. It is a 15-meter resolution global image mosaic of the Earth, produced from more than 8,200 individual Landsat 7 scenes. These images have been collected during 1999-2003.
Visible
- The maximum resolution is 15 m per pixel.
- Uses bands 3, 2, 1
Pseudo
- The maximum resolution is 15 m per pixel.
- Uses bands 5, 4, 2.
Data Acquisition
Landsat 7 only gets one chance every 16 days to cover any given area. If there are clouds, fog, smog, snow on the ground (too white), too much grass on the ground (too green), too low or too high sun angle (low contrast), satellite maintenance, solar storm, etc, that chance is lost. A few bad takes in a row, and a whole year is lost. A scene is 160x180km, and a perfect scene has to have perfect conditions for the whole area.
Landsat 7 was launched in 1999 and now it has some data quality problems. The U.S. government is currently working toward a Landsat Data Continuity Mission (LDCM), which will field a Landsat-like sensor on board the next-generation NOAA/DoD weather monitoring platform, or on-board a dedicated satellite.
The Landsat 7 data will be the best available global images for quite a while, and the fact that they are free and available on the net makes them even more significant.
External Links
- An Introductory Landsat Tutorial
- emporia.edu - has information about the bands
- GeoCover 1990 and Geocover 2000 product descriptions (.pdf files)
- OnEarth
- i-cubed
- MDA Federal


